
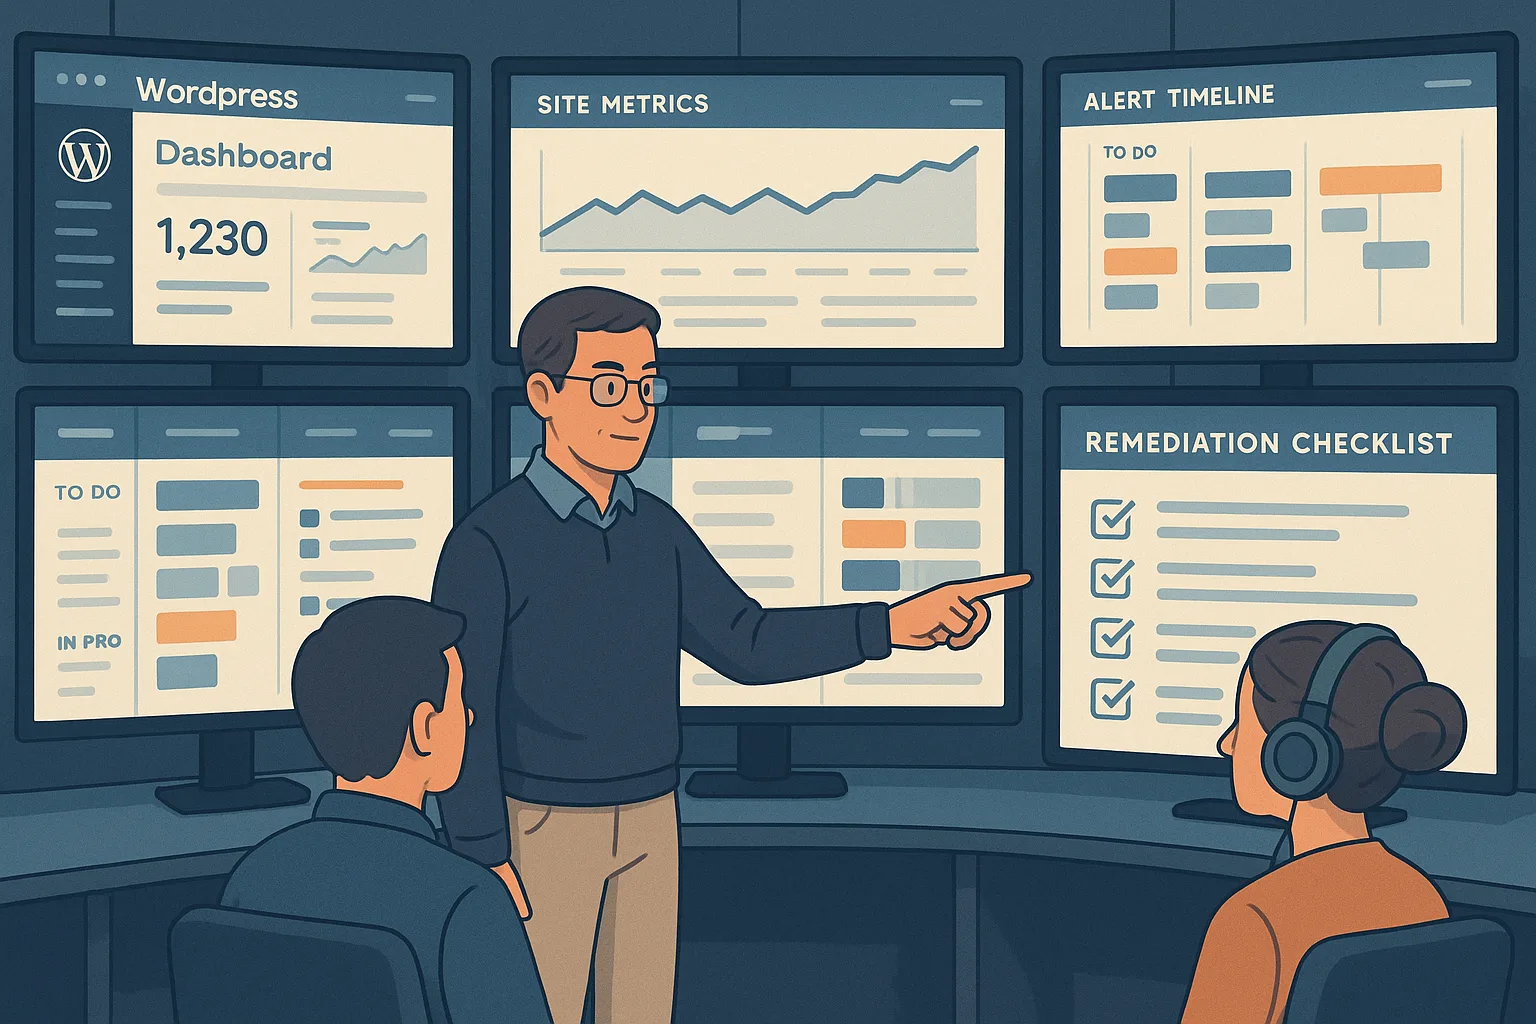
As an agency operator responsible for dozens of client WordPress installs, you see the same flood of telemetry every week: repeated plugin warnings, suspicious requests that never quite cross a confidence threshold, and noisy scanners that bury the real threats. This article is an operator-oriented, step-by-step blueprint that turns that noise into prioritized, repeatable remediation — so you reduce alert volume and actually fix root causes.
- Why noisy telemetry kills operator productivity
- How do I turn noisy telemetry into concrete remediation?
- Step 1 — Ingest: centralize and normalize client telemetry
- Step 2 — Triage: classify by confidence, scope, and blast radius
- Step 3 — Contain first, ask questions later
- Step 4 — Remediate: targeted, minimal-impact fixes
- Step 5 — Verify and close the loop
- How do you prioritize when multiple clients generate the same alert pattern?
- Actionable checklist: telemetry-to-remediation (operator copy)
- Operational notes: building repeatable playbooks
- Repeatable checks to reduce noise over time
- How to scale these patterns across many clients
- Implement this blueprint with a single solution
- Further reading and playbooks
- Final checklist before you close an incident
- FAQ
Why noisy telemetry kills operator productivity
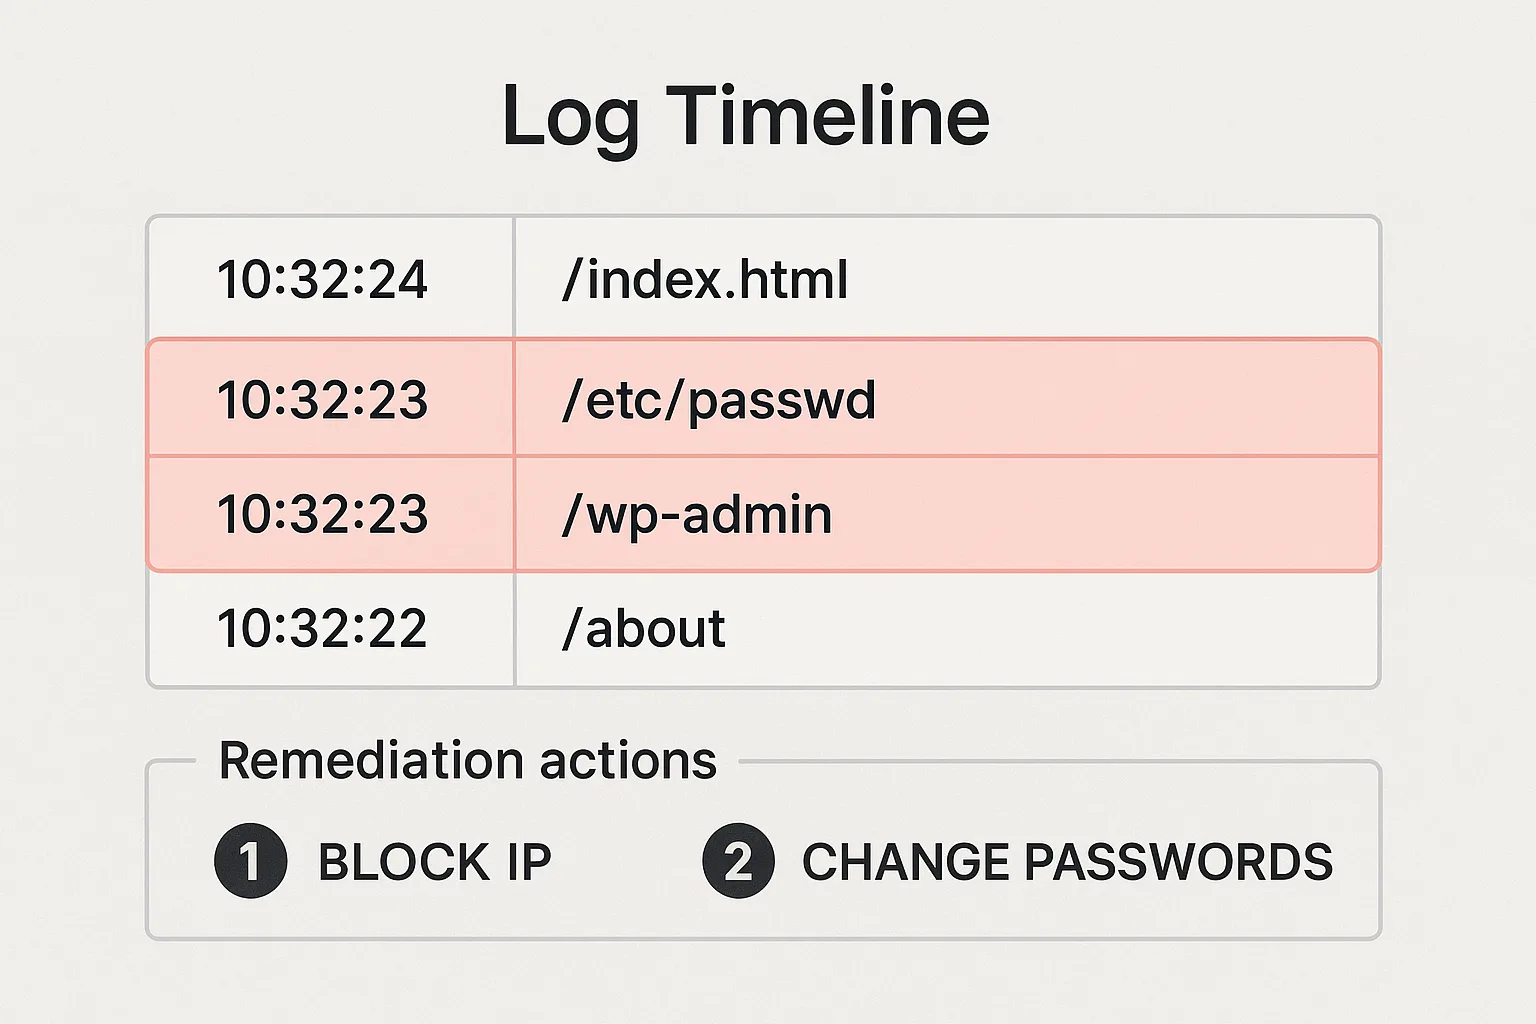
Log timeline with highlighted suspicious requests and remediation labels
Telemetry without context creates busywork. When every alert looks urgent, nothing is prioritized. Your job is to turn raw signals into context-rich entries in a triage queue, and then apply containment or remediation ordered by actual risk to the client. The rest of this blueprint shows how to do that repeatably.
How do I turn noisy telemetry into concrete remediation?
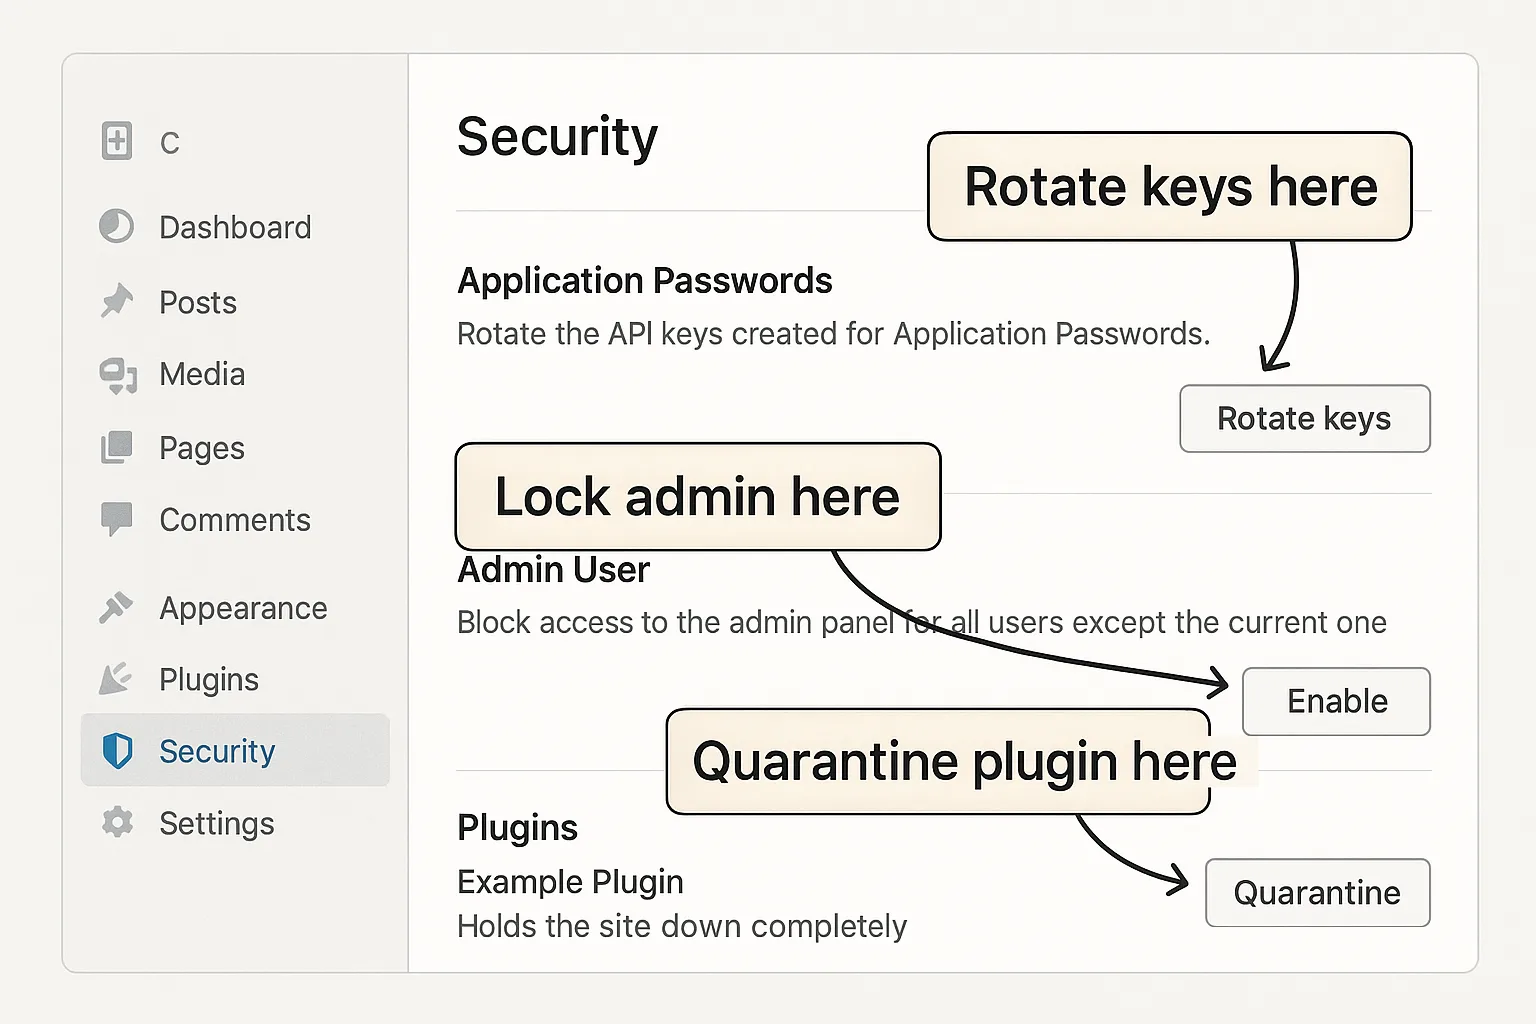
Mock WordPress admin security panel with callouts for key hardening actions
Start by mapping each alert to three attributes: confidence, privilege scope, and business impact. That mapping immediately tells you whether to contain, remediate, or monitor, and creates a single prioritized list you can act on across all client sites.
Step 1 — Ingest: centralize and normalize client telemetry
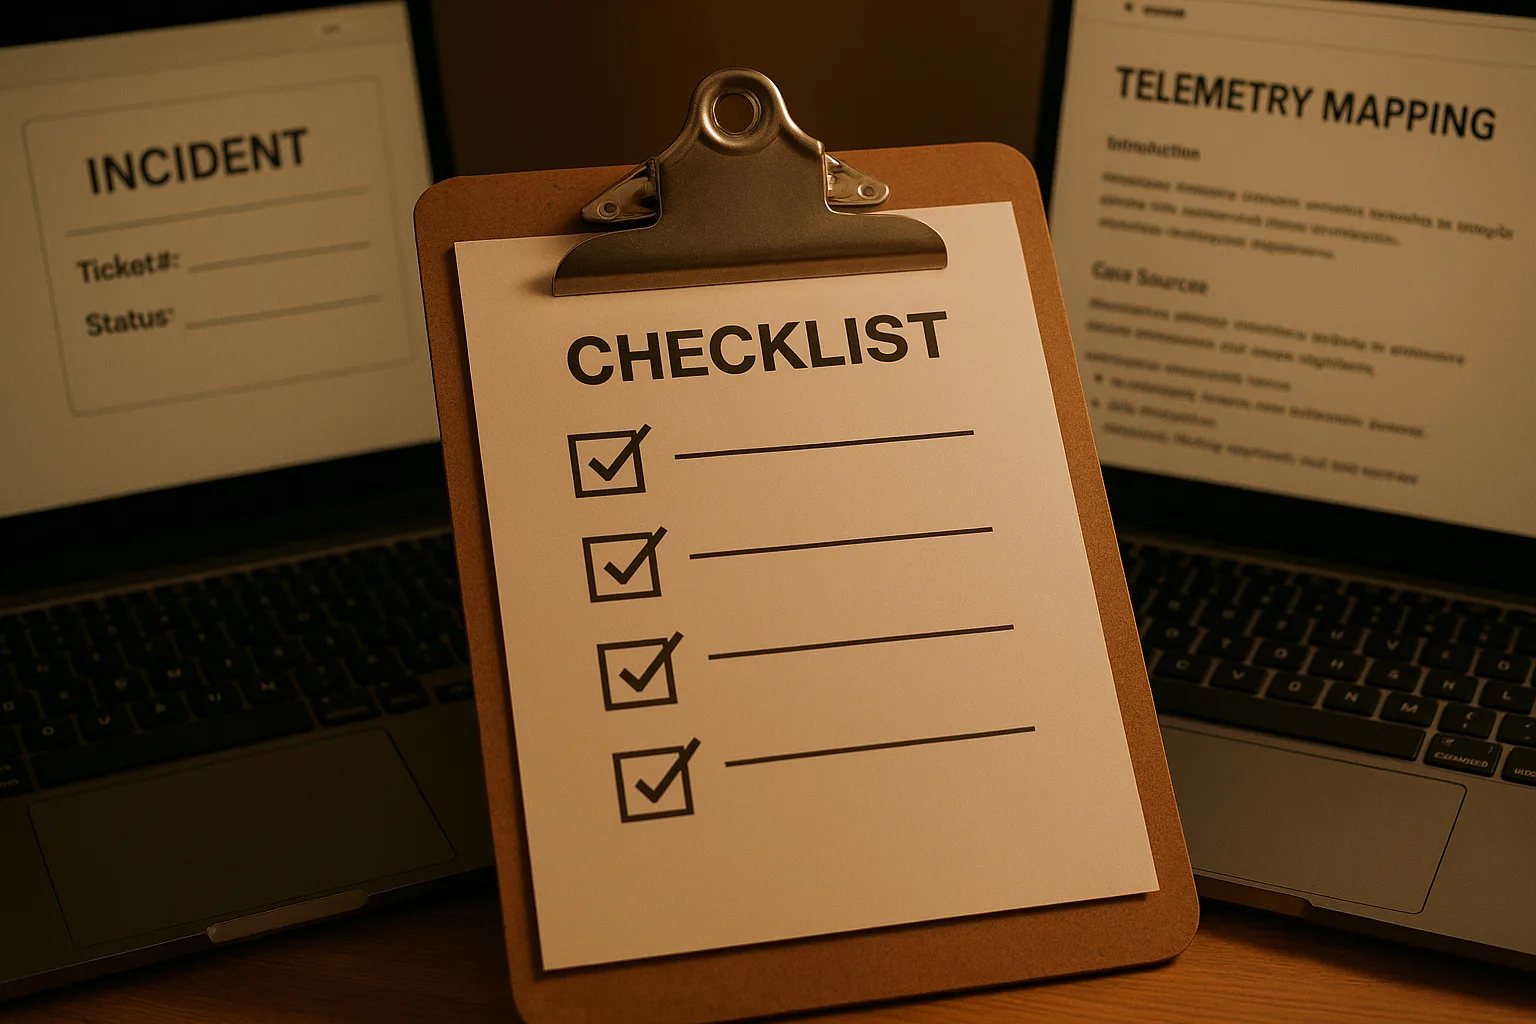
Physical checklist beside a laptop showing incident ticket and telemetry documentation
Collect logs and alerts into one timeline for each incident: server access logs, plugin scanner output, WAF events, and any endpoint monitoring you run. Normalization means consistent timestamps, IP indicators, and a shared set of labels (e.g., USER_ADMIN, WEB_SHELL, OUTBOUND_CONN) so different tools speak the same language.
Practical example
For one client, map an outbound connection seen in server logs to a suspicious POST in access logs and a matching alert from your WordPress scanner. When combined, these three low-confidence signals become a single High confidence incident.
Tooling note
When you talk about telemetry normalization with clients, include a pointer to documentation for any in-house monitoring or alerting endpoints you use (for example, see your operator documentation to standardize webhooks and alert payloads): Hack Halt documentation — alerting and remediation.
Step 2 — Triage: classify by confidence, scope, and blast radius
Every normalized event gets three tags: CONFIDENCE (High/Medium/Low), SCOPE (single-user, admin-role, site-wide), and BLAST_RADIUS (low/medium/high based on business impact). This transforms a stream of alerts into a ranked queue.
How to score confidence
High confidence examples: web shell execution, clear evidence of privilege escalation, or a verified file change to core/theme/plugin files. Medium: unusual but explainable behavior that aligns with a plugin update window. Low: single anomalous request from a residential IP with no follow-ups.
Step 3 — Contain first, ask questions later
Containment buys time. For High confidence incidents, apply immediate isolation actions: lock down admin endpoints, rotate impacted credentials, and block attacker IPs at the perimeter. Do these before troubleshooting to reduce the blast radius.
Containment checklist (example)
- Rotate admin and API keys for affected accounts.
- Enable temporary admin route restrictions or require 2FA for all logins.
- Block offending IP addresses and related subnets in the WAF.
Step 4 — Remediate: targeted, minimal-impact fixes
After containment, remediate the root cause. Remove malicious files, revert unauthorized option changes, and patch or replace exploited components. Always prefer surgical fixes that restore integrity without unnecessary downtime.
Example sequence for a compromised plugin
- Disable the plugin at the code level or via CLI to avoid partial execution.
- Scan for backdoors and web shells and remove malicious artifacts.
- Replace with a verified copy and lock the plugin directory permissions.
Step 5 — Verify and close the loop
Run focused verification: re-scan with your WordPress scanner, validate that the alert no longer reproduces, and confirm key user journeys (login, checkout) still function. Add the confirmed indicators to your detection rules to prevent repeats.
For more operator guidance on scanning workflows, review the internal tool that feeds your remediation queue: WordPress Scanner.
How do you prioritize when multiple clients generate the same alert pattern?
Prioritize by blast radius and exposed privileges: a Medium-confidence alert on a site with admin users who handle payments outranks a High-confidence alert on a low-traffic brochure site. Triage to protect the highest business impact first and schedule lower-risk remediations into maintenance windows.
Actionable checklist: telemetry-to-remediation (operator copy)
- Collect logs: centralize server, plugin, and WAF logs into a single timeline.
- Normalize fields: timestamp, IP, user, and event classification.
- Tag each event: CONFIDENCE / SCOPE / BLAST_RADIUS.
- Contain High confidence: lock admin, rotate keys, block IPs.
- Remediate root cause: remove web shells, restore verified files, patch exploited components.
- Verify fixes: re-scan, reproduce alerts, test critical flows.
- Document: incident timeline, remediation steps, and lessons for playbooks.
- Automate repeatable containment and add signatures to scanners.
Operational notes: building repeatable playbooks
Codify decisions into reusable playbooks so junior operators can follow the same remediation path and you stop re-solving the same problems. Keep playbooks small: trigger, containment, remediation, verification, and rollback instructions.
Example playbook entries
Include clear trigger conditions (e.g., “web shell output + outbound connections within 10 minutes = High”), and a validated remediation command set that an operator can run with confidence.
Integrating with client SLAs
Map playbook urgency to your client SLAs. High-confidence incidents should have an agreed SLA for containment and a separate SLA for full remediation.
Repeatable checks to reduce noise over time
After fixing root causes, take these preventive steps on each client: minimize active plugins, enforce least-privilege admin roles, schedule regular integrity scans, and add targeted alerting rules that only surface when signals correlate across sources. Your goal is fewer but higher-quality alerts.
See a full operational roadmap to hardening and containment for more layered defense guidance: Operational Roadmap: Harden WordPress and Contain Malware & Web Shells.
How to scale these patterns across many clients
Use a centralized queue that accepts normalized telemetry from all clients and enforces a single triage rubric. Automate containment for low-risk actions (IP blocks, rate limits) and reserve manual steps for high-privilege changes. This reduces cognitive load and helps your team operate efficiently.
Implement this blueprint with a single solution
If you want to implement these controls quickly across client sites, Hack Halt offers focused operator tooling and managed controls that map directly to the containment and remediation steps in this blueprint — see pricing and get started.
Further reading and playbooks
Build on this blueprint with linked playbooks and teardown guides that show the exact misconfigurations to avoid: a deep dive on telemetry-to-remediation is available in How WordPress Hacks Unfold: Turning Noisy Telemetry into Concrete Remediation, and operator hardening patterns are detailed in related guides you should add to your runbook.
Final checklist before you close an incident
- Confirm root-cause removal and re-run scans.
- Rotate affected credentials and audit privileged accounts.
- Document the incident and update playbooks with signatures and improved detection rules.
- Schedule follow-up hardening tasks and client-facing remediation summaries.
FAQ
How quickly should I convert an alert into a remediation task?
Convert any alert that matches high-confidence indicators (active web shell output, admin privilege escalation, or unusual outbound connections) into a remediation task within 30–60 minutes. For lower-confidence telemetry, group similar signals and prioritize by blast radius and account privileges — then schedule remediation within your next maintenance window.
Can I automate remediation, or should everything be manual?
Automate low-risk, repeatable fixes like IP blocks, rate limiting, or plugin state checks, but perform manual verification for changes that touch admin accounts, file integrity, or active e-commerce checkout flows. Automation is powerful for containment; human review is still required for root-cause elimination.
What if a client resists taking immediate remediation steps?
Frame remediation in terms of risk and business impact: explain the likely blast radius, give a concise remediation cost estimate (time and downtime), and offer a staged approach that starts with containment actions requiring no visible downtime. Use your operator playbook to present a clear, low-friction path forward.
For ongoing operator reference and a rapid scanner you can run as part of your verification step, bookmark the WordPress Scanner and the broader documentation hub at Hack Halt Inc. to keep your playbooks current.