This playbook is written for the WordPress site owner who wears many hats: hosting manager, developer, and security operator without a full SOC. It focuses on turning noisy security telemetry — endless plugin alerts, false-positive WAF blocks, and confusing log spikes — into concrete remediation steps you can execute quickly to reduce blast radius and restore trust. If your goal is noisy telemetry remediation wordpress, this playbook gives repeatable triage rules, concrete commands, and templates you can implement immediately.
- Why noisy telemetry kills response speed
- How do you turn noisy telemetry into remediation?
- Quick triage checklist (actionable)
- Implementation steps: automation and simple recipes
- Comparison: telemetry sources, noise patterns, and concrete actions
- Playbook: containment, remediation, recovery (stepwise)
- Incident mini-case study: noisy alerts that hid an admin compromise
- Which telemetry should you prioritize today?
- Tune to reduce future noise
- Checklist: immediate actions you can run now
- What to change in your routine to stay ahead
- Post-incident artifacts and report template
- Further reading and internal resources
- Product note — implement fast with a single tool
- Closing: make telemetry a tool, not noise
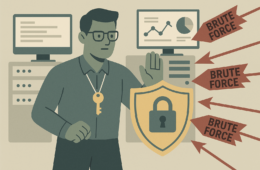
Why noisy telemetry kills response speed
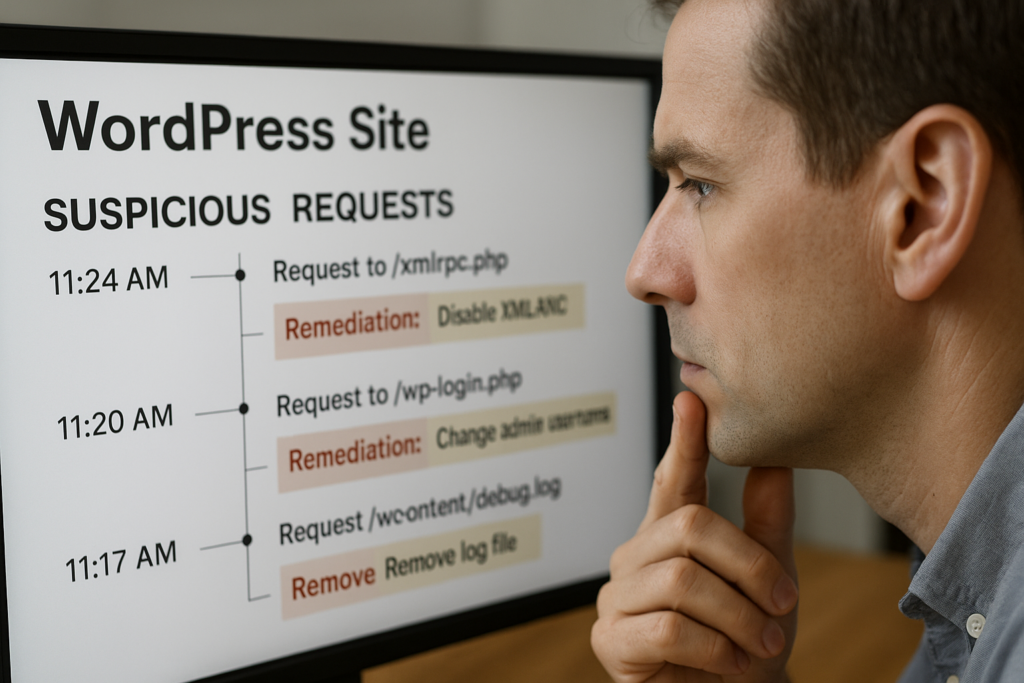
Site owner reviewing suspicious request timeline and marking remediation steps
When every alert looks urgent, nothing gets fixed. Noise drains attention, delays containment, and creates gaps attackers exploit. Treat telemetry as a signal-to-action pipeline, not an endpoint: every alert should map to one of three outputs (confirmable artifact, impact assessment, and an immediate action). If you can’t map an alert to those outputs within your SLA, it becomes noise.
Sources of noise
Common noisy inputs: plugin scanners emitting heuristic alerts, WAFs flagging automated scans, analytics spikes from benign crawlers, and scheduled cron jobs that look like probes. Identifying the source helps you normalize expectations and create reliable triage rules.
Consequences of ignoring noise
Ignored noise breeds alert fatigue: missed compromises, delayed patching, and inconsistent response. The result is higher blast radius and longer recovery windows. Teams with chronic noise often end up taking heavy-handed actions (mass password resets, whole-site restores) that disrupt customers unnecessarily.
How to think about telemetry
Reframe telemetry by expected impact: categorize alerts by what they can touch (admin accounts, payment flows, filesystem). That framing makes prioritization deterministic instead of emotional. Use a simple rubric: Confirmability, Impact, Immediate Action. If an alert fails the confirmability check (no artifact, no reproducible input) lower its priority and route it to a review queue with context.
How do you turn noisy telemetry into remediation?
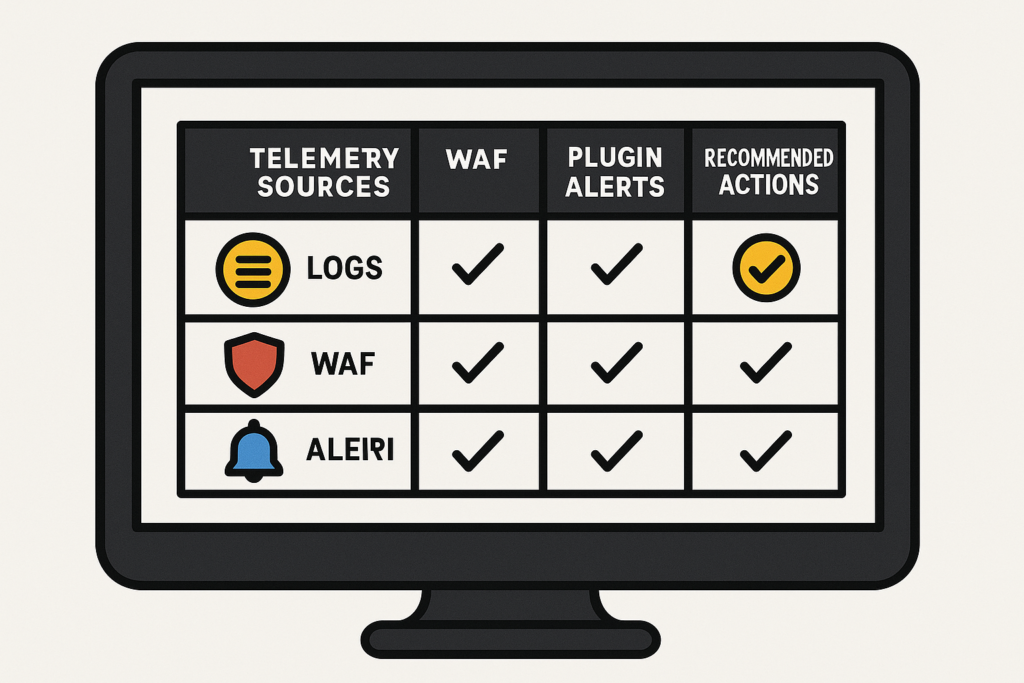
Comparison table on telemetry sources with recommended actions
Streamline outcomes to three outputs: confirmability (can you reproduce or collect an artifact?), impact (what can be harmed right now?), and an immediate action (contain, remediate, or monitor). Use those three outputs to decide the next step within 10 minutes for urgent alerts (P0/P1) and within 1 hour for medium priority (P2). Below is a simple priority rubric you can copy into your runbook.
- P0 (Critical): Confirmable admin account takeover, web shell with file writes, payment endpoint manipulation. Action: immediate containment and forensics.
- P1 (High): Reproducible file changes in core/plugins, repeated credential stuffing against admin users. Action: containment and targeted remediation within 2 hours.
- P2 (Medium): Heuristic scanner flags, crawler spikes, WAF blocks that look benign. Action: validate, tune, and monitor.
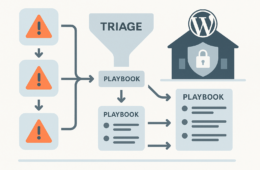
Quick triage checklist (actionable)
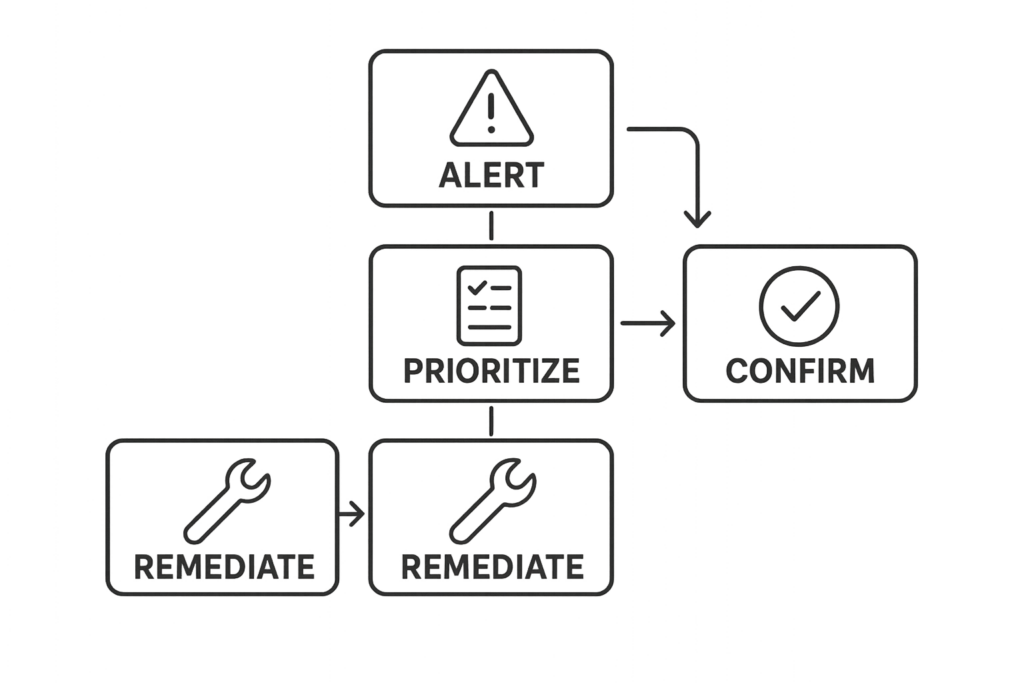
Flowchart of a five-step triage and remediation process
This checklist is your go/no-go at the 10-minute mark. Run these steps in order and stop when you reach containment.
- Identify alert source and timestamp; centralize the raw event into one console.
- Check if the event touches privileged areas (wp-admin, payment endpoints, file uploads).
- Collect quick artifacts: request headers, POST payload, file diff of changed files if present.
- Search login history and user activity for concurrent anomalies.
- If admin access is involved: revoke sessions, rotate affected credentials, and block IPs temporarily.
- If file writes are involved: isolate the site (maintenance mode), and pull the site to a staging host for deeper analysis.
- Log the triage decision and next steps in your incident timeline (who did what, and when).
Implementation steps: automation and simple recipes
Automate the boring parts of triage so humans can focus on decisions. The following recipes are lightweight and implementable on most managed WordPress stacks.
Centralize telemetry
- Forward plugin scanner alerts, WAF logs, and auth logs to a single log store (SIEM, ELK, or a hosted aggregator).
- Create ingestion rules to tag events with site path, environment (prod/staging), and deploy timestamp.
- Correlate by IP, user agent, and user ID to reduce duplicate alerts.
Automated triage rules
- If an alert references /wp-admin and POST requests, escalate to P0 if user is admin and request contained file data.
- If a plugin scanner flags a core file and the file checksum changed within the last 24 hours, auto-create a staging copy and run a diff job.
- Throttle repeated login attempts and add automatic temporary lockouts for IPs with >30 attempts in 5 minutes.
Practical commands and grep patterns
Use these commands as quick artifacts collectors on the server or staging copy. Adjust paths for your environment.
- List WordPress users:
wp user list --fields=ID,user_login,user_email,roles - Destroy an active session for a user (requires WP CLI session command or plugin):
wp user session destroy - Search for recent file modifications:
find . -type f -mtime -3 -print - Show file checksum:
sha256sum wp-includes/version.php - Server log grep for suspicious POSTs:
grep -i "POST /wp-admin" /var/log/nginx/access.log | tail -n 200
Comparison: telemetry sources, noise patterns, and concrete actions
| Telemetry Source | Typical Noise | Concrete Remediation Action | Fast Triage Takeaway |
|---|---|---|---|
| Plugin scanner | Heuristic flags; outdated signatures | Confirm file hash, check plugin changelog, patch or roll back plugin | Validate with file diff before acting |
| WAF / CDN | Automated scans, false-positive rules | Whitelist safe crawlers, tighten rules for POSTs to admin endpoints | Look at blocked payloads; escalate if POST shows web-shell content |
| Server logs | High-volume bots, malformed probes | Block abusive IP ranges, throttle requests, add challenge pages | Correlate with login and file-change events |
| Auth logs | Credential stuffing noise | Force 2FA, lock suspicious accounts, reset sessions | Protect admin accounts first |
Playbook: containment, remediation, recovery (stepwise)
Use these pragmatic steps after quick triage confirms a real issue. The goal: minimize blast radius in under 2 hours. Below is a practical timeline you can copy into your incident response plan.
Containment (0–30 minutes)
- Revoke access, block IPs, put the site in restricted/maintenance mode, and isolate backups.
- Invalidate sessions and force password reset for impacted users; enable 2FA for all admin accounts immediately.
- Create a forensically-sound staging copy: rsync or snapshot the site, note times, and freeze the copy for analysis.
Remediation (30–90 minutes)
- Remove malicious files and web shells on the staging copy first; document every file removed or changed.
- Apply the smallest safe change to revert to a known-good state — patch or rollback a plugin rather than mass deletions.
- Validate by running a test plan: login as admin, simulate payment flow, and run a site scan to ensure no remaining artifacts.
Recovery (90 minutes–2 hours)
- Restore validated backups to production during a maintenance window.
- Rotate API keys, OAuth tokens, and any third-party credentials that might have been exposed.
- Put short-term monitoring rules in place to watch affected endpoints for 7–14 days and log all anomalies for post-incident review.
Incident mini-case study: noisy alerts that hid an admin compromise
Context: A mid-sized WooCommerce site received daily plugin scanner alerts for a core file “modified” signature. The alerts were dismissed as false positives until customers reported strange admin notices. Triage revealed a reused password on an admin account that had been silently compromised. The attacker dropped a small web shell and performed selective order changes.
Action taken: The owner isolated the site, invalidated admin sessions, rotated credentials, and pulled a staging copy for file diff. They removed the web shell, restored the core file from a verified backup, and applied targeted patches. Post-incident they tightened admin workflows and added strict monitoring on order endpoints. The lesson: consistent triage of recurring scanner noise and prioritizing admin-access alerts stopped a slow-bleed compromise before payment information was affected.
Related resources you can use while building your response: Minimize WooCommerce Blast Radius and Avoid These Admin-Access Mistakes provide tactical follow-up steps for eCommerce managers.
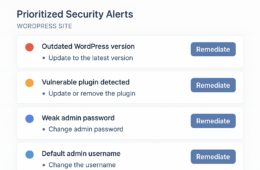
Which telemetry should you prioritize today?
Prioritize telemetry that indicates access to admin-level functionality, file write operations, or payment-related endpoints. Those events have the highest immediate blast radius and should trigger expedited containment and remediation in every case. If you need a short checklist to operationalize prioritization, use this:
- Admin-authenticated actions affecting core, plugins, or uploads — immediate escalation.
- File writes to /wp-content or any PHP file changes — isolate and analyze.
- POSTs to payment endpoints or webhook URLs that are unexpected — contain and review logs.
Tune to reduce future noise
After each incident, document which alerts were useful and which were noise. Update rules to filter known benign patterns, add context fields (site path, plugin owner, recent deploys), and reduce duplicate alerts by correlating them at ingestion. A lightweight post-incident checklist helps:
- Log the root cause and whether the noisy alert helped detect it.
- Adjust scanner sensitivity or whitelist a safe signature source.
- Create or refine correlation rules to suppress duplicates for 24–48 hours after deploys.
- Add context tags (deploy ID, change owner) to future alerts so triage has immediate context.
Where documentation helps
When settings or a control are available in your security tooling, link the configuration directly to a guide so triage steps are reproducible. For controls provided by Hack Halt documentation, follow the operational steps in the product docs to automate containment and recovery.
See the product documentation for implementation steps: https://hackhalt.com/documentation/
Checklist: immediate actions you can run now
- Centralize the last 24 hours of telemetry into one timeline and tag duplicates.
- Prioritize events touching /wp-admin, /wp-content/uploads, and payment endpoints.
- Collect artifacts: suspect request, file diffs, and user session history.
- Contain: revoke sessions for affected accounts and put the site in maintenance mode if file writes are present.
- Remediate on staging first, then apply to production once validated.
- Rotate credentials and add short-term monitoring rules for 14 days post-incident.
- Run a post-incident review and add at least one durable automation rule to reduce the same noise next time.
What to change in your routine to stay ahead
Schedule a weekly 30-minute telemetry hygiene session: review recurring alerts, tune filters, and test your containment playbook. Small, repeatable improvements reduce alert fatigue and shorten incident windows. Consider adding these recurring tasks:
- Weekly: review top 5 alert signatures and label them keep/tune/disable.
- Monthly: run a simulated incident (table-top) using your playbook and refine roles and timelines.
- Quarterly: validate backups by performing a restore to staging and running the application smoke tests.
Post-incident artifacts and report template
Capture these items for every incident — they make future noisy telemetry remediation easier and provide evidence for auditors or stakeholders:
- Timeline of events (timestamp, alert, action taken, owner).
- Collected artifacts (logs, request headers, file hashes, screenshots).
- Root cause analysis and follow-up actions (who will implement and when).
- Changes to automation or rules that reduce identical noise in the future.
Further reading and internal resources
Use these Hack Halt resources to expand the playbook and harden what matters most:
- Battle-Tested WordPress Security Checklist — use this to align your monitoring & recovery playbooks with incident priorities.
- Layered Response Blueprint — focused steps when file modifications or web shells are suspected.
- How WordPress Hacks Actually Happen — operator perspective to reduce exploit risk and understand telemetry patterns.
Product note — implement fast with a single tool
To implement these controls quickly and avoid stitching disparate tools, deploy Hack Halt Inc. as your central operator console and automation engine: Start with Hack Halt Inc.
Closing: make telemetry a tool, not noise
Noise is inevitable; ignored noise is dangerous. Use the prioritization rules, the quick triage checklist, the implementation recipes, and the containment/remediation steps in this playbook to convert noisy telemetry into repeatable actions. Each incident you manage shrinks the attack surface and makes your alerts more meaningful. For additional tactical hardening and admin access guidance, review resources like Hardening Admin Access and Privileged Workflows and Battle-Tested Playbook: Stop Brute-Force & Credential Stuffing.